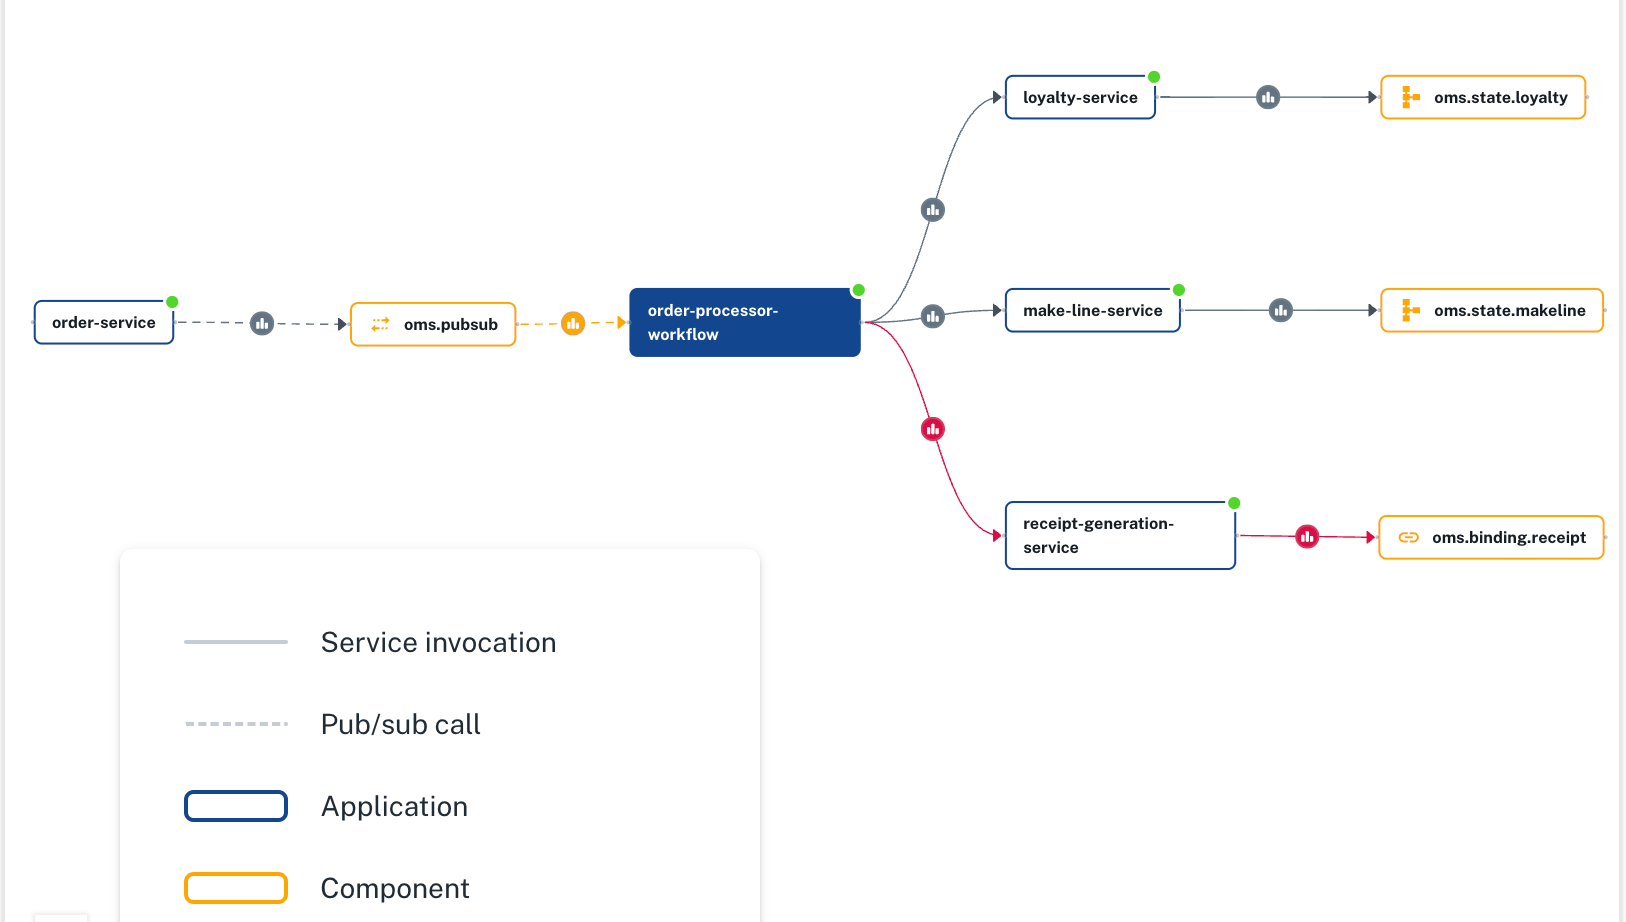
Navigate to Applications to see all Dapr apps deployed on the cluster.View Apps Graph to visualize apps as a network topology, generated using Dapr metrics.Visualize interactions between apps and infrastructure, and spot issues such as slow or failing requests.

Diagrid Conductor | Apps Graph Visualization

Demonstrates how to visualize application interactions using Diagrid Conductor. Discovers application and component connections, zooms into a specific app to reveal network metrics, slow responses, and errors.